For people who pick their own stocks

Understand any S&P 500 stock in one answer.

Type a company. See its trend, a research signal with the reasons behind it, the next earnings date and your own position, in plain English. Then screen the whole index for more like it.

Free plan, no card. Research only, never advice.

Ask about any S&P 500 company

Sample answer from the Oct 9, 2026 close. Research only, not advice.

  • NVDA$217.23HOLD
  • AAPL$342.00BUY
  • GOOGL$349.22BUY
  • GOOG$344.91BUY
  • MSFT$539.44BUY
  • AMZN$254.76HOLD
  • META$736.72BUY
  • AVGO$344.33SELL
  • TSLA$362.44HOLD
  • MU$931.24HOLD
  • BRK.B$525.68BUY
  • LLY$1,251.61BUY
  • AMD$562.23BUY
  • JPM$335.53HOLD
  • WMT$117.87HOLD
  • V$399.75BUY
  • XOM$174.68BUY
  • JNJ$253.28HOLD
  • INTC$95.37HOLD
  • MA$616.32HOLD
  • PLTR$200.50BUY
  • ABBV$283.40BUY
  • CSCO$109.85HOLD
  • ORCL$134.47SELL
  • COST$978.01HOLD
  • CVX$219.32BUY
  • AMAT$430.01HOLD
  • LRCX$277.46HOLD
  • BAC$51.70BUY
  • KO$92.00BUY

Prices from the Oct 15, 2026 close.

Three jobs, one calm workspace.

01

Understand one stock

Type a company name. Ask answers with its price trend, a BUY / HOLD / SELL research signal and every factor behind it, the next earnings date, your own position, and a plain-English read.

Every term has a one-tap definition, so you learn as you go.
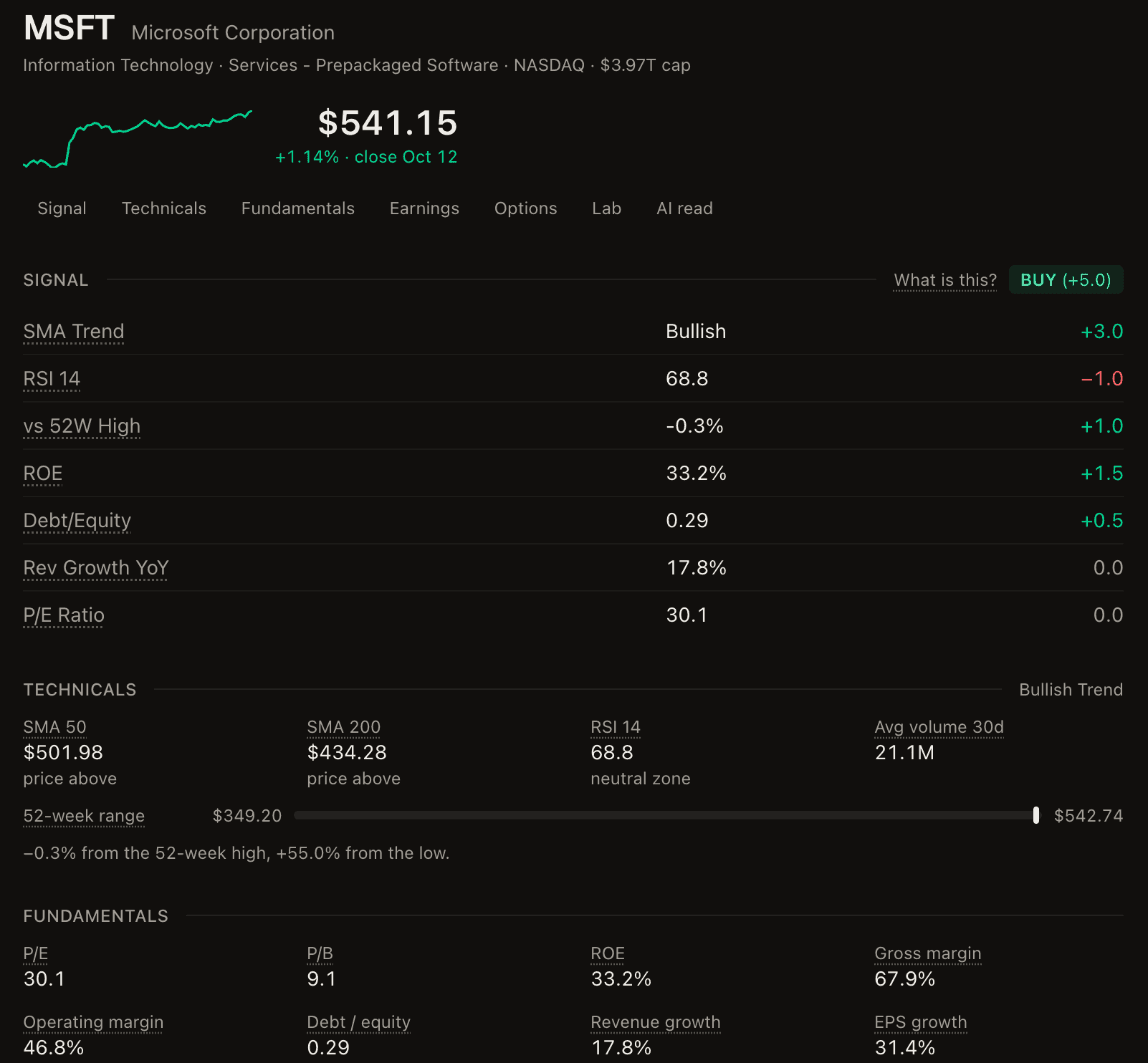
Ask report for Microsoft: $541.15, a BUY signal of +5.0 with seven scored factors, technicals and fundamentals.

02

Find more like it

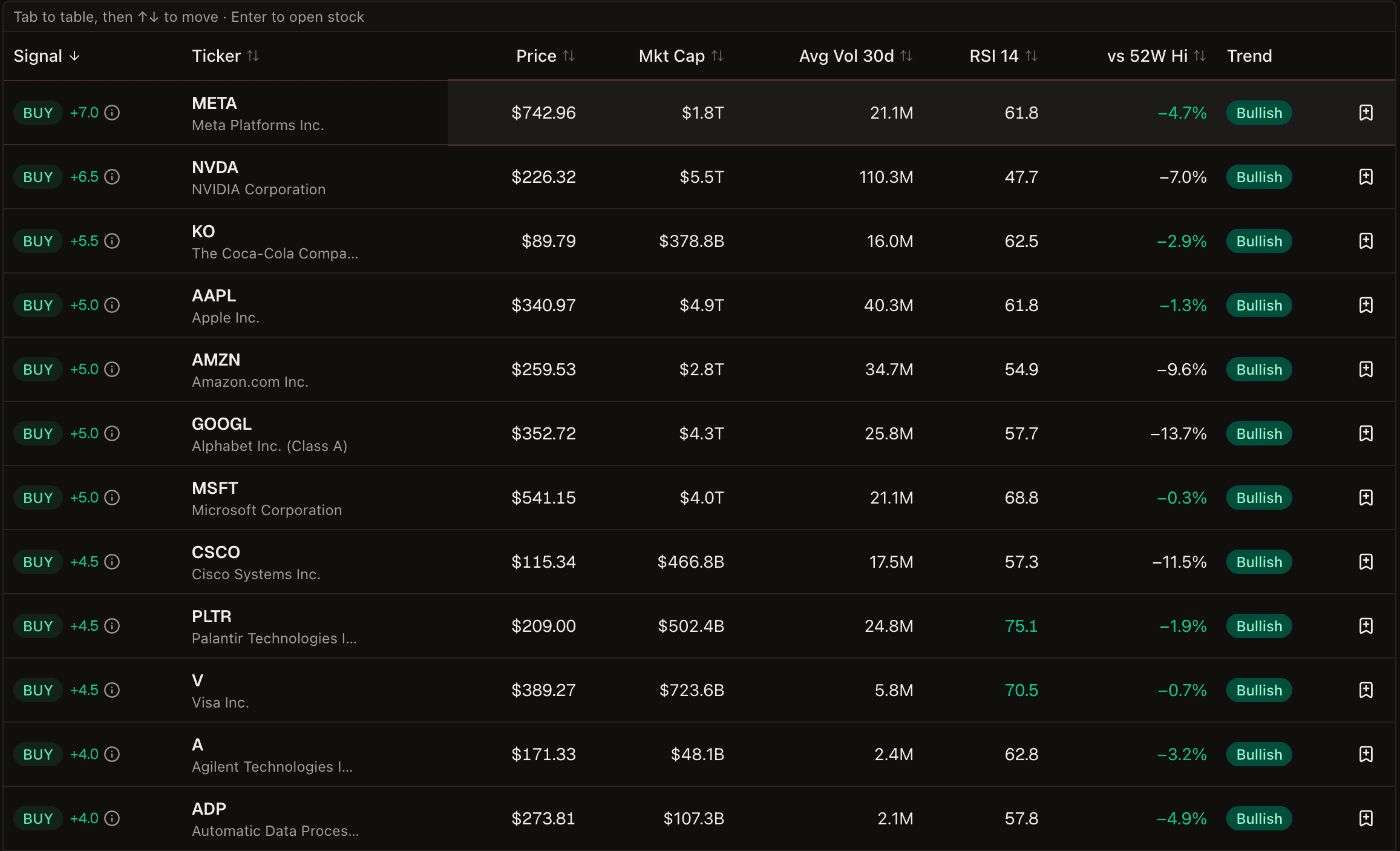
Pick a ready-made screen such as “Big companies in an uptrend”, or describe one in your own words. The screener shows exactly what it understood and what it didn’t, then ranks the S&P 500 by signal.

Save screens, backtest them, export to CSV, or share a link.

Screener results for Big companies in an uptrend: S&P 500 names ranked by signal, with price, market cap, volume, RSI and distance from the 52-week high.

03

Keep track of what you own

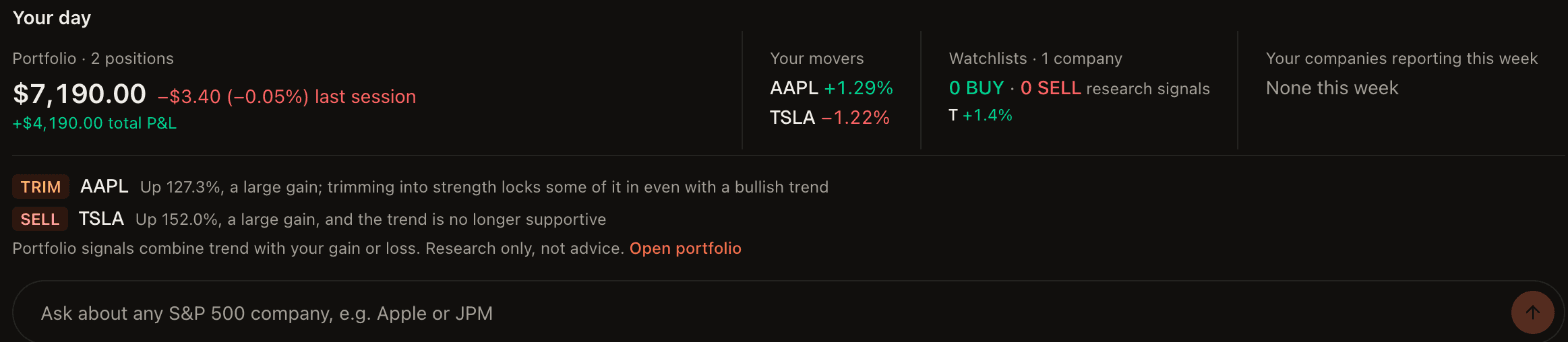
Your dashboard opens on your day: portfolio value and change, your best and worst movers, positions flagged TRIM or SELL with the reason, watchlist signals, and which of your companies report this week.

Alerts email you when a price or signal crosses your line.

Dashboard Your day: portfolio value $7,190.00, last-session change, top movers, and positions flagged TRIM and SELL with their reasons.

Honest about what the data can and can’t tell you.

Dated, sourced numbers
Every price shows its as-of date and turns amber or red when data is late.
Signals show their work
Each BUY or SELL lists the factors and points that produced it.
Gaps say “missing”
When a vendor has no data for a company, we say so instead of guessing.
Research, not advice
No trading, no tips. Tools to help you decide for yourself.

Start free. Upgrade when it earns it.

Compare plans

Free

$0

  • Ask reports on any S&P 500 company
  • Screener with starter screens
  • 3 saved screens, 1 watchlist, 3 alerts

Pro

Most popular

$10/mo

  • Portfolio with TRIM / SELL reasons
  • Plain-English screens and backtests
  • 10 saved screens, 5 watchlists, 20 alerts, CSV export

Pro Ultra

$40/mo

  • AI read and follow-up questions in Ask
  • AI plain-English screens and composite scoring
  • Unlimited screens, watchlists, alerts

Options research (Income scans, earnings-week plays, Pricing Lab) is in limited preview while we license options data.

Ask about the first company on your mind.

Create a free account